Hãy nhập câu hỏi của bạn vào đây, nếu là tài khoản VIP, bạn sẽ được ưu tiên trả lời.


bạn uống lộn thuốc hả
I. Nội qui tham gia "Giúp tôi giải toán"
1. Không đưa câu hỏi linh tinh lên diễn đàn, chỉ đưa các bài mà mình không giải được hoặc các câu hỏi hay lên diễn đàn;
2. Không trả lời linh tinh, không phù hợp với nội dung câu hỏi trên diễn đàn.
3. Không "Đúng" vào các câu trả lời linh tinh nhằm gian lận điểm hỏi đáp.
Các bạn vi phạm 3 điều trên sẽ bị giáo viên của Online Math trừ hết điểm hỏi đáp, có thể bị khóa tài khoản hoặc bị cấm vĩnh viễn không đăng nhập vào trang web
I. Nội qui tham gia "Giúp tôi giải toán"
1. Không đưa câu hỏi linh tinh lên diễn đàn, chỉ đưa các bài mà mình không giải được hoặc các câu hỏi hay lên diễn đàn;
2. Không trả lời linh tinh, không phù hợp với nội dung câu hỏi trên diễn đàn.
3. Không "Đúng" vào các câu trả lời linh tinh nhằm gian lận điểm hỏi đáp.
Các bạn vi phạm 3 điều trên sẽ bị giáo viên của Online Math trừ hết điểm hỏi đáp, có thể bị khóa tài khoản hoặc bị cấm vĩnh viễn không đăng nhập vào trang web.

1 his sickness, peter didn't go to school yesterday
2 the bad condition of the house, the city council demolished it
3 he studied well, he got scholarship
4 he didn't try his best, he fail the exam
5 by broken car on the high way, I was late for the work
1. his sickness, peter didn't go to school yesterday.
2. the bad condition of the house, the city council demolished it.
3. he studied well, he got scholarship.
4. he didn't try his best, he fail the exam.
5. by broken car on the high way, I was late for the work.

1.how are you?
2.duck.
3.pencil.
4.fence.
5.the backpack.
1.how are you?
2.duck.
3.pencil.
4.fence.
5.the backpack.


1 This is a door
2 It's a red apple
3 Touch your head
4 It's a desk
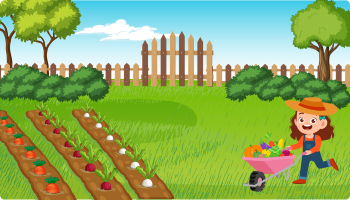
5 There is a garden

Refer:
The line graph depicts a comparison between the consumption of three categories of fast food eaten by Australian teenagers over 25 year period from 1975 to 2000. In general, there was a gradual fall in consuming fish and chips while pizza and hambergers had an opposite trend.
As the graph shows, the amount of fish and chips peaked at 100 times per year in 1975. Then, there was a fluctuation during period from 1975 to 1985 before standing at about 95 times. Following this, the need for fish and chips significantly decreased to a low of nearly 40 times in 2000.
By contrast, pizza and hamburgers became more popular and their expenditure substantially went up. Looking at the details, pizza’s consumption rised steadily from about 2 times in 1975 to over 80 times in 1995, though its figure leveled off from 1995 to 2000. wise, there was a considerable increase of hamburgers’ rate from 5 times to approximately 83 times. This rise was noeable between 1975 and 1985 but the growth slowed during the remaining period.


 ╭╮
╭╮ _
_ ☻ ♦ ♣ ♠ ♥
 ♪ ♫ ☼
♪ ♫ ☼  ✿ ⊰ ⊱ ✪ ✣ ✤ ✥ ✦ ✧ ✩ ✫ ✬ ✭ ✯ ✰ ✱ ✲
  ❃ ❂ ❁ ❀ ✿ ✶
 ❉ ❋ ❖ ⊹⊱✿ ✿⊰⊹ ♧ ✿
  ツⓛ ⓞ ⓥ ⓔ ♡ ღ ☼★ ٿ « » ۩ ║ █ ● ♫ ♪ ☽


 ☜
☜ 


 peace
peace 


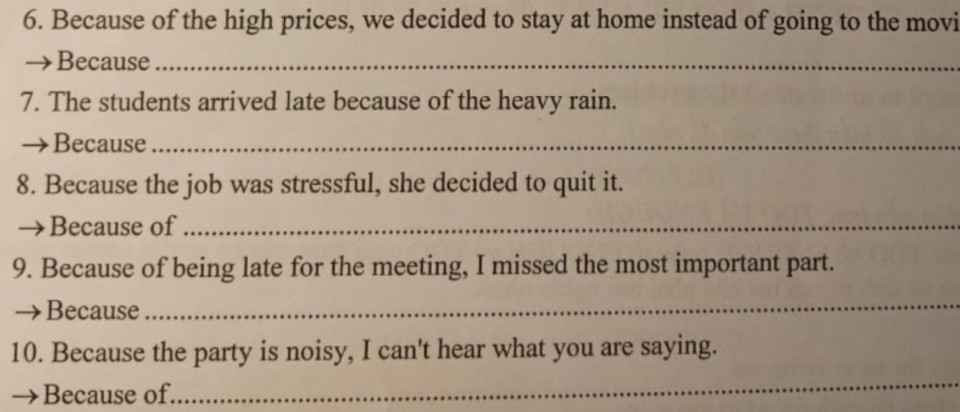
6 Because the prices are high, we decided to stay....
7 the rain was heavy, the students arrived late
8 the stressful job, she decided to quit it
9 I was late for the meeting, I missed the most important part
10 the noisy party, I can't hear what you are saying
6. Because the prices are high, we decided to stay....
7. the rain was heavy, the students arrived late.
8. the stressful job, she decided to quit it.
9. I was late for the meeting, I missed the most important part.
10. the noisy party, I can't hear what you are saying.