Hãy nhập câu hỏi của bạn vào đây, nếu là tài khoản VIP, bạn sẽ được ưu tiên trả lời.


Intelligent Robots play a vital role in modern days. Besides benefits, we must consider disadvantages when using them.
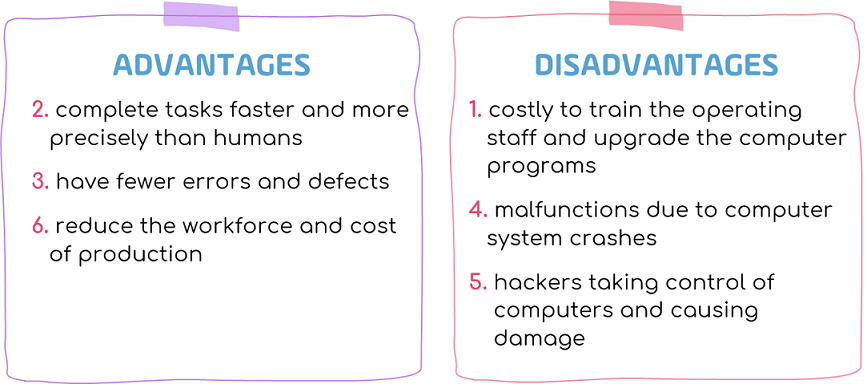
First, look at the most positive points. Thanks to robots and A.I technology, the number of workforce can be reduced but the production even increases more, especially in the manufacturing industry. The robots can perform the tasks faster than the humans and much more consistently and accurately. They can work at places 24/7 without any salary and food. Additionally, they don’t get bored. In medicine, they helps doctors to diagnose diseases, do the surgeries, especially tiny surgeries with highest accuracy. In some hospitals, the robo pets can help the patients with depression and they keep them active.
On the contrary, robots bring about some troubles. First and for most, training is needed to operate the system, so we need to pay for scientists and trainees, maintenance and reparation expenditure, which raise the cost overall. Another point I’d to mention is the machine malfunction, which creates lots of troubles and confusions, and even sometimes lead to unexpected accidents. It’s reported that a robot in a car manufacturing factory killed a worker. This results in a worrisome of people using A.I for medical purposes. Furthermore, the robots are not able to act any different from what they are programmed to do. With the heavy application of robots, the humans may become overly dependent on the machines, losing their mental capacities. If the control of robots goes in the wrong hands, the robots may cause the destruction.
In conclusion, I suppose that we need to take advantages of A.I to make our life better, but remember its dangers and risks to take precaution timely.
Dịch:
Robot thông minh đóng một vai trò quan trọng trong thời hiện đại ngày nay. Ngoài lợi ích, chúng ta phải xem xét những bất lợi khi sử dụng chúng.
Trước tiên, hãy nhìn vào những điểm tích cực nhất. Nhờ robot và công nghệ A.I, số lượng lao động có thể giảm xuống nhưng năng suất thậm chí còn tăng nhiều hơn, đặc biệt là trong ngành chế tạo. Các robot có thể thực hiện các nhiệm vụ nhanh hơn con người và hơn nữa một cách nhất quán và chính xác. Chúng có thể làm việc tại các địa điểm 24/7 mà không cần có lương hay thực ăn. Ngoài ra, chúng không cảm thấy buồn chán. Trong y học, chúng giúp các bác sĩ chẩn đoán bệnh tật, phẫu thuật, đặc biệt là các tiểu phẫu với độ chính xác cao nhất. Ở một số bệnh viện, thú nuôi robot có thể giúp bệnh nhân trầm cảm và giữ họ hoạt động.
Ngược lại, robot tạo ra một số rắc rối. Đầu tiên nhất, đào tạo là cần thiết để vận hành hệ thống, do đó chúng ta cần phải trả cho các nhà khoa học và học viên, chi phí bảo dưỡng và sửa chữa, làm tăng chi phí tổng thể. Một điểm tôi muốn đề cập đến là sự cố máy móc, tạo ra nhiều rắc rối, và thậm chí đôi khi dẫn đến những tai nạn không ngờ đến. Đã được ghi nhận rằng một robot trong một nhà máy sản xuất xe hơi giết chết một công nhân. Điều này dẫn đến một sự đáng lo ngại của người sử dụng A.I cho mục đích y tế. Hơn nữa, các robot không thể hành động khác với những gì chúng được lập trình để làm. Với việc ứng dụng nhiều robot, con người có thể trở nên quá phụ thuộc vào máy móc, mất khả năng tinh thần của họ. Nếu sự kiểm soát của robot đi sai hướng, các robot có thể gây ra sự phá hủy.
Tóm lại, tôi cho rằng chúng ta cần tận dụng lợi thế của A.I để làm cho cuộc sống của chúng ta tốt hơn, nhưng hãy nhớ đến những nguy cơ và rủi ro của nó để kịp thời phòng ngừa.
You can use this to refer:
Intelligent Robots play a vital role in modern days. Besides benefits, we must consider disadvantages when using them.
First, look at the most positive points. Thanks to robots and A.I technology, the number of workforce can be reduced but the production even increases more, especially in the manufacturing industry. The robots can perform the tasks faster than the humans and much more consistently and accurately. They can work at places 24/7 without any salary and food. Additionally, they don’t get bored. In medicine, they helps doctors to diagnose diseases, do the surgeries, especially tiny surgeries with highest accuracy. In some hospitals, the robo pets can help the patients with depression and they keep them active.
On the contrary, robots bring about some troubles. First and for most, training is needed to operate the system, so we need to pay for scientists and trainees, maintenance and reparation expenditure, which raise the cost overall. Another point I’d to mention is the machine malfunction, which creates lots of troubles and confusions, and even sometimes lead to unexpected accidents. It’s reported that a robot in a car manufacturing factory killed a worker. This results in a worrisome of people using A.I for medical purposes. Furthermore, the robots are not able to act any different from what they are programmed to do. With the heavy application of robots, the humans may become overly dependent on the machines, losing their mental capacities. If the control of robots goes in the wrong hands, the robots may cause the destruction.
In conclusion, I suppose that we need to take advantages of A.I to make our life better, but remember its dangers and risks to take precaution timely.

Em viết phần intro nha:
The chart above decsribes how the birth rates of 2 countries namely China, USA changed in 80 years which started from 1920
Answer:
The line graph compares the birth rates in China and the US and how these rates changed from 1920 to 2000.
Overall, there was a general decline in fertility of both nations throughout the time surveyed. However, the US’s birth rates almost was higher than that of China over the whole period.
American saw a significant fluctuation in the birth rates between 1920 to 1935, but it always remained over 10%. However, in the following decade, the fertility of the US decreased sharply to under 5 %. From 1945 to 1950, there was a rapidly increased in American’s birth rates, at 15%, reaching the highest point of it’s own during the whole period. From that on, the fertility of the US fell gradually to 7% in 2000.
During the 80-year period, the birth rates in China changed more significantly than in the US. It fell down to 5% in the year 1940, then reaching a peak of whole line graph in 1950, at 20%. Over the remainder of the period, China saw a sharply drop in the birth rates to only about 2% until 2000.

43 had sold - bought
44 takes - is driving
45 is falling
46 watered - was
47 has chased
48 has played - left
49 have been
50 didn't see

* Paragraph 1: Habitat and location of the species below. (Đoạn 1: Môi trường sống và địa điểm của các loài được liệt kê bên dưới.)
Example:
- Komodo dragons are found in the wild... (Rồng Komodo được tìm thấy trong hoang dã ...)
- They live in forests,... (Chúng sống trong rừng, ...)
* Paragraph 2: Physical features and diet (Đặc điểm về hình thể và chế độ ăn uống)
Example:
- Although they are called dragons, they look ... (Mặc dù chúng được gọi là rồng nhưng chúng trông giống ...)
* Paragraph 3: Population and conservation status (Số lượng đàn và tình trạng bảo tồn)
Example:
- There are about 6,000... (Có khoảng 6.000 con ...)
-According to the IUCN Red List, Komodo dragons are classified as... (Theo sách đỏ của Tổ chức Bảo tồn Thiên nhiên Quốc tế, rồng Komodo được xếp vào....)
Blue whales are the largest animals to have ever existed.
(Các voi xanh là động vật lớn nhất từng tồn tại.)
They live in the cold waters of the Arc and Antarc but they migrate to tropical seas to breed.
(Chúng sống ở vùng nước lạnh ở Bắc Cực và Nam Cực nhưng chúng di cư đến vùng biển nhiệt đới để sinh sản.)
This breeding season lasts for about four months.
(Mùa sinh sản thường kéo dài tới bốn tháng.)
Blue whales are mammals but they look fish.
(Cá voi xanh là động vật có vú nhưng chúng nhìn giống như cá.)
They are 30 meters long and weigh about 150-200 tons.
(Chúng dài khoảng 30 mét và nặng khoảng 150-200 tấn.)
The earth's largest animal, the blue whale, usually eats very small shellfish and can eat 4 to 8 tons of krill per day.
(Là động vật lớn nhất trên trái đất nhưng cá voi xanh thường ăn các loại sinh vật có vỏ rất nhỏ và có thể ăn từ 4 tới 8 tấn nhuyễn thể mỗi ngày.)
A blue whale's tongue alone can weigh as much as an elephant — its heart as much as an automobile.
(Riêng lưỡi của cá voi xanh nặng bằng một con voi và trái tim của nó có thể nặng bằng một chiếc ô tô.)
There are about 14,000 blue whales in total (10,000 in the Antarc and 4,000 in the Arc).
(Có tổng số khoảng 14 nghìn con cá voi xanh (trong đó 10 nghìn con ở Nam Cực và 4 nghìn con ở Bắc Cực).)
According to the World Conservation Union (IUCN) Red List, blue whales are classified as endangered.
(Theo Sách đỏ của Cơ quan Bảo tồn Quốc tế, cá voi xanh được phân loại là có nguy cơ bị tuyệt chủng.)
Blue whales have few predators but are known to be victims in attacks by sharks and killer whales, and many are injured or die each year from collisions with large ships.
(Cá voi xanh có ít kẻ săn mồi nhưng chúng được cho là nạn nhân trong các đợt tấn công của cá mập và cá voi ăn thịt và nhiều con bị thương hoặc chết mỗi năm do va chạm với tàu lớn.)
Their lives are also badly affected by pollution and global warming.
(Cuộc sống của chúng cũng bị ảnh hưởng nghiêm trọng bởi ô nhiễm và hiện tượng trái đất nóng lên.)
In order to protect blue whales and stop them from declining, there are many recovery plans that have been launched.
(Để bảo vệ các voi xanh và ngăn chặn số lượng loài này bị suy giảm, có nhiều giải pháp khôi phục đã được đưa ra.)

Câu 1: A.
Câu 2: C.
Câu 3: D.
Câu 4:B.
Câu 5:C.
Mình chỉ làm đến câu 5 thôi nhé.

Poverty is no shame
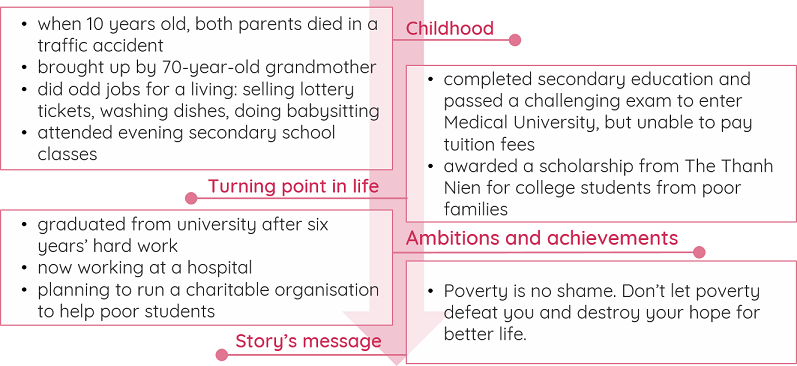
My parents died in a traffic accident when I was ten years old, so I grew up with my grandmother who was too old and weak to work. I had to leave school and did odd jobs to earn a living: selling lottery kets, washing dishes and doing babysitting. When I was 15, my grandma encouraged me to attend evening classes, so I could improve my literacy and job prospects.
After lots of hardship and effort, I completed secondary education and passed a challenging exam to enter Medical University, which is the dream of many students. However, I could not pay the tuition fees and had to reject the offer. The door to a new life was closed before me. I was completely disappointed and saw only gloomy days ahead.Then something incredible happened: I was awarded a scholarship from The Thanh Nien for college students from poor families. This was really a turning point in my life because I could start my university studies and hope for a better future.
Six years of hard work at the university and of trying to live on a very tight budget came to an end at last. Now I am working as a doctor at a hospital, but I will never forget those difficult days. I am planning to set up and run a charitable organisation to help poor students, as a way to acknowledge other people for supporting me.
I've told my own story hoping to encourage other people me to overcome hard times. Don't let poverty defeat you and destroy your hopes for a better future. This is my motto.

Name: ( Write your name )
Address: ( your address )
Mobile: ( write you mobilephone )
Email: ( write your email )
Personal summary and career objectives
I am a responsible individual who can work hard, communicates well, and has excellent interpersonal skills. I have recently completed upper secondary education and received the National Certificate of Secondary Education. I am seeking a starting position as a barista so that obtain real-world experience and learn new skills.
Education and qualifications
2019-2021: Dich Vong Upper Secondary School
2015 -2019: Dich Vong Lower Secondary School
2010 - 2015: Dich Vong Primary School
Work experience
Summer, 2020: Waiter at a student canteen
Responsibilities
Greeting customers and arranging seats for them
Taking orders from customers and serving them snacks and drinks
Skills
Good communication and interpersonal skills
Interests
Reading books about making drinks
Learning foreign languages
References
Available upon request
TL
Hi , my name is .... and i would to apply for a position in the city zoo . When I was little, I always dreamed of working in a zoo and i think this a great opportunity to apply for this job .I love animal and have many years of experience in taking care of animal so i think this will be easy to do this job
HT

At twenty-five past nine, the bell rings and all the students go into the yard. It's time for recess. They are all happy and exited. They mêt their friends and have some fun. Many are talking about the last class or last movie. Some are eating and drinking as well as chatting. Some students are playing games like blindman's bluff or catch. Some boys are playing marbles and some girls are skipping rop. But the most popular activity is talking. The yard is very noisy until the bell rings. Then everyone goes indoors and classes begin again.


Minh likes collecting stickers in a beautiful album. The sticker album was passed around to everyone in his class presentation. All sorts of stickers were collected from other countries. The pupils were amazed at his collection. Some questions were given. When Trang saw it, she asked him if he was interested in exchanging stickers. She started collecting a month ago. Minh was more than happy to see Trang's stickers. He agreed to help her with her collection.


Khi viết về biểu đồ tròn trong IELTS Writing Task 1, bạn cần tuân theo một cấu trúc rõ ràng để phân tích một cách đầy đủ và mạch lạc:
1. Mở bài:
Giới thiệu ngắn gọn nội dung của biểu đồ bằng cách diễn đạt lại đề bài. Ví dụ: "Biểu đồ tròn minh họa sự phân bổ các nguồn năng lượng được sản xuất tại Pháp vào các năm 1995 và 2005."
2. Tổng quan:
Khái quát những xu hướng chính mà bạn quan sát được. Ví dụ: "Có thể thấy rằng tỷ lệ năng lượng được tạo ra từ xăng dầu giảm đi, trong khi tỷ lệ từ than và khí đốt lại tăng nhẹ."
3. Thân bài:
Phân tích chi tiết sự khác biệt, có thể dựa theo từng năm hoặc theo từng loại năng lượng. Ví dụ:
"Năm 1995, than chiếm tỷ lệ cao nhất trong sản xuất năng lượng, với 29,8%, trong khi xăng dầu chiếm 29,3%. Đến năm 2005, tỷ lệ từ than tăng lên 30,9%, trong khi xăng dầu giảm đáng kể, chỉ còn khoảng 20%."
4. Kết luận:
Đánh giá xu hướng chung dựa trên dữ liệu, nhưng không giới thiệu dữ liệu mới. Ví dụ: "Nhìn chung, trong khi tỷ lệ từ than và khí đốt tăng, sự phụ thuộc vào xăng dầu đã giảm đi đáng kể trong vòng một thập kỷ."
Việc sử dụng các so sánh rõ ràng và các con số chính xác sẽ giúp bài viết của bạn chặt chẽ hơn và đạt được kỳ vọng khi phân tích biểu đồ tròn trong bài thi IELTS.
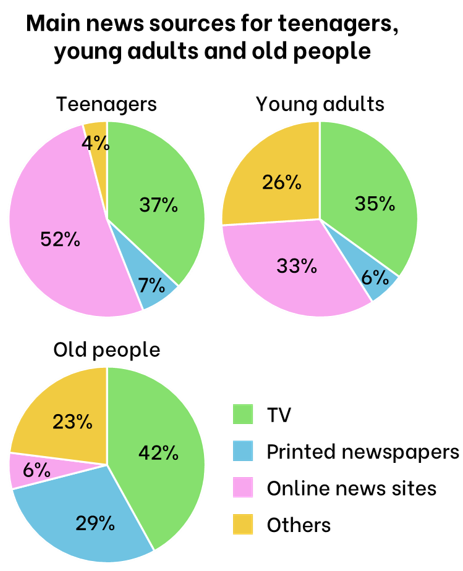
The pie charts compare the main news sources for teenagers, young adults, and old people according to a survey in 2022.
Overall, television was a very popular source of news for all age groups. It was the top news source for old and young adults, chosen by 42 per cent of old people and more than one third of young adults and teenagers. Meanwhile, online news sites were chosen by the majority of teenagers, with more than 50 per cent. By contrast, the Internet was the least common news source for old people, with just 6 per cent. On the other hand, printed newspapers were the main news source for 29 per cent of old people while only fewer than 10 percent of young adults and teenagers reported getting their news from them.
As for other sources of news, around a quarter of young adults and old people relied on other sources for news, as opposed to only 4 percent of teenagers.