Bài học cùng chủ đề
Báo cáo học liệu
Mua học liệu
Mua học liệu:
-
Số dư ví của bạn: 0 coin - 0 Xu
-
Nếu mua học liệu này bạn sẽ bị trừ: 2 coin\Xu
Để nhận Coin\Xu, bạn có thể:

Writing a description of a line graph SVIP
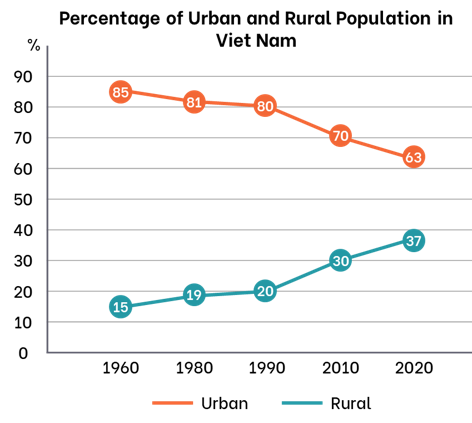
The line graph below illustrates population trends in Viet Nam from 1960 to 2020. Write a description (120-150 words) of the graph. Use the suggestions below to help you.
The line graph shows population trends in Viet Nam from 1960 to 2020. Overall, the urban population ...
In 1960, most Vietnamese people … However, from 1960 to 1980, ... From 1990, ...
By contrast, the urban population rose throughout the same period. In 1960, ... In 1980, ... From 1990, ...

Hướng dẫn giải:
Sample:
The line graph shows the urban and rural population in Viet Nam from 1960 to 2020. Overall, the urban population increased while the rural population decreased.
In 1960, most Vietnamese people lived in rural areas. However, from 1960 to 1980, the percentage of the rural population fell slightly to 81 per cent. Then the figure remained stable for the next ten years. From 1990 to 2000, the proportion of the population living in rural areas continued to decrease gradually. In 2020, the rural population was only 63 per cent of the total population of Viet Nam.
By contrast, the urban population rose throughout the same period. In 1960, the percentage of the city population was just around 15 per cent. The figure went up slightly in 1980 and remained stable until 1990 when less than 20 per cent of the population lived in urban areas. Since 1990, the proportion of the urban population has increased gradually and in 2020, it reached 37 per cent of the total population.
