Bài học cùng chủ đề
Báo cáo học liệu
Mua học liệu
Mua học liệu:
-
Số dư ví của bạn: 0 coin - 0 Xu
-
Nếu mua học liệu này bạn sẽ bị trừ: 2 coin\Xu
Để nhận Coin\Xu, bạn có thể:

Writing a description of a pie chart SVIP
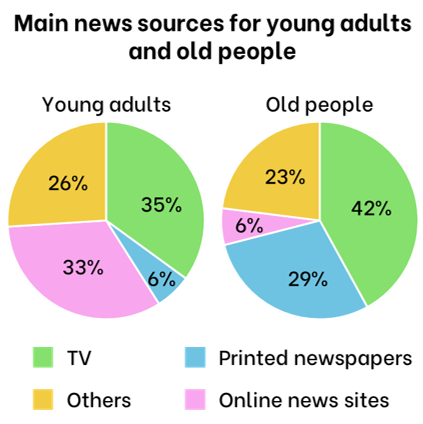
The pie charts below show the main news sources for young adults and old people according to a survey in 2022. Study the charts and choose the correct answer.

__________ remained the most popular source of news for both age groups.
The pie charts below show the main news sources for young adults and old people according to a survey in 2022. Study the charts and choose the correct answer.

Nearly a third of __________ turned to printed newspapers for news.
The pie charts below show the main news sources for young adults and old people according to a survey in 2022. Study the charts and choose the correct answer.

Old people showed a much higher preference for __________ than young adults.
The pie charts below show the main news sources for young adults and old people according to a survey in 2022. Study the charts and choose the correct answer.

Online news sites were the second most popular choice for __________.
The pie charts below show the main news sources for young adults and old people according to a survey in 2022. Study the charts and choose the correct answer.

The percentage of young adults using online news sites was much __________ than that of old people.
The pie charts below show the main news sources for young adults and old people according to a survey in 2022. Study the charts and choose the correct answer.

__________ were the least popular source of news for old people.
The pie charts below show the main news sources for young adults and old people according to a survey in 2022. Study the charts and choose the correct answer.

__________ a quarter of young adults relied on other sources for news.
The pie charts below show the main news sources for young adults and old people according to a survey in 2022. Study the charts and choose the correct answer.

Other sources of news were chosen by around __________ of the people in both age groups.
Complete the description with the words and phrases given.

The pie charts compare the main sources of news for young adults and old people based on a survey conducted in 2022.
, television was the most popular source of news for both age groups, with 42% of old people and just over a third of young adults relying on it. , a significant proportion of young adults preferred online news sources, with 33% choosing them, just 6% of old people. By contrast, old people favored printed newspapers, with 29% using them as their for news, while only 6% of young adults chose newspapers. young adults, who increasingly turn to digital platforms, old people still prefer traditional media. In both age groups, around relied on other sources for news.
(Kéo thả hoặc click vào để điền)
Match the expressions with the same meanings.
Match the expressions with the same meanings.
Put the phrases in the correct columns.
- The pie charts compare …
- By contrast, …
- On the other hand ...
- Similarly, …
- The pie charts show …
- The pie charts illustrate …
To introduce the pie charts
To compare different sections

Bạn có thể đăng câu hỏi về bài học này ở đây
